Imagine you’ve got a two-year grant to study a particular hematologic phenotype, or you are a PhD student whose project has just gained traction, but your remaining time is limited by your program. You know generally what experiments you want to do, so isn’t that enough?
Sure, if you want to increase the risk of not completing your project on time and within budget.
All of us know that science is not the same as building a bridge; there’s a higher level of serendipity involved wherein an experiment can negate the hypothesis or open an unexpected avenue to be pursued. However, developing a strategy that orders experiments logically and in a way that fully takes advantage of the time available can ensure efficiency regardless of the scientific outcome. Below are some steps to take to help devise a timeline for your project:
- Revisit the project scope. In the first part of this series we discussed the scope of the project; i.e., what the project involves. This is defined based on what work is required to address the underlying hypothesis, what personnel are available to perform the work, and how much it costs. Understanding these factors is crucial for developing a timeline. In addition, if the scope is too large to fit within a timeline, then one of two things will need to happen: either the budget and/or the personnel is adjusted upward to compensate, or the scope needs to be adjusted downward to encompass a smaller set of aims. In other words, project management is dynamic; you may be halfway or all the way through developing a timeline and realize that the scope is too large or too small and will adjust accordingly. Revisiting the scope of the project also ensures that you are not allocating excess effort toward sudden ‘shiny things’ or other potential distractions.
- Revisit deliverables. This is relatively straightforward but is critical
for timeline development and is closely linked to project scope. If
your deliverable is a manuscript at the end of two years, you will need
to factor in time for writing and figure preparation. If your
deliverable is a published manuscript, time will need to be factored in
for peer review and revision activity.
- Identify the work needed to generate your deliverables. In project
management-speak, this is called a work breakdown structure, or WBS. For
instance, to generate your manuscript you know you will need to do two
serial transplants, an RNA-seq analysis of purified HSC, a cell cycle
analysis and immunophenotypic analysis of your cells of interest. Each
one of these items becomes a ‘work package’ within the WBS. The WBS
itself can be a bunch of sticky notes on a wall or headings on a
whiteboard; start at the top with the work packages and from each, you
can work iteratively to identify specific tasks, as in Figure 1. What is
shown in the figure is unlikely to be the complete set of tasks for
each work package. You can break down each task into individual, smaller
operations as well; in the project management world a WBS can be 5-10
layers deep below the work packages. Note that the goal is not yet to
order everything or establish how long each work package takes. The goal
is to identify what you need to do, to the best of your knowledge, to
complete the project. Generating a WBS can help uncover these tasks
before you start the project, so you can account for them in terms of
time, effort and budget and revise scope if necessary.
 |
| Figure 1 |
- Determine dependencies for your work. This is an overly complex way of
saying ‘make a flowchart.’ Order your tasks across time (here’s where
sticky notes are particularly helpful since you can rearrange them) such
that you can determine what tasks are dependent on others, and sequence
them accordingly. In our example, it’s a pretty logical flow (Figure
2). For brevity’s sake I haven’t included every task (including the
re-transplant) though you will want to for a real planning session. Note
that I had forgotten we also need to breed the donor mice. I remembered
while constructing the flowchart and added it in. It’s an equally
important task upon which the rest of the tasks are dependent.
 |
| Figure 2 |
- Now determine how much time each task and work package will require. The value of this type of work analysis is that you will uncover work packages or tasks where time is clearly a factor: for instance, you realize your serial transplant will take between eight and ten months of your two-year timeframe (Figure 3). You also become cognizant that breeding the second set of recipients would take a similar amount of time as for the first round (2 months). This will help you define how to order your tasks in time, i.e., when to start each one, as well as how to order the overall work packages.
 |
| Figure 3 |
- Identify resources you will need for each task. This practice will help you to further refine your work packages and assist in their final ordering in time. For instance, maybe you will need 10 mice per group for statistical power – perhaps this means increasing the number of breeders, or increasing the time needed to breed. Likewise, perhaps your RNA-seq data analysis requires a bioinformatics collaborator. They may have their own timeframe in which they are available to help out on your project, and it may require paying a portion of their salary. You can also start identifying costs of mouse cages and the like. All of these factors will influence your timeline. If you have extra budget, perhaps you find that purchasing donor and recipient animals directly from a supplier will help shave off a few months of your time dedicated to breeding animals for the transplant. Your work packages can then be revised accordingly. By the end of the planning session, you know what you need for each task, from mice to staff to sorters and beyond. You also can cross reference these needs with your budget to see if you’re within tolerances.
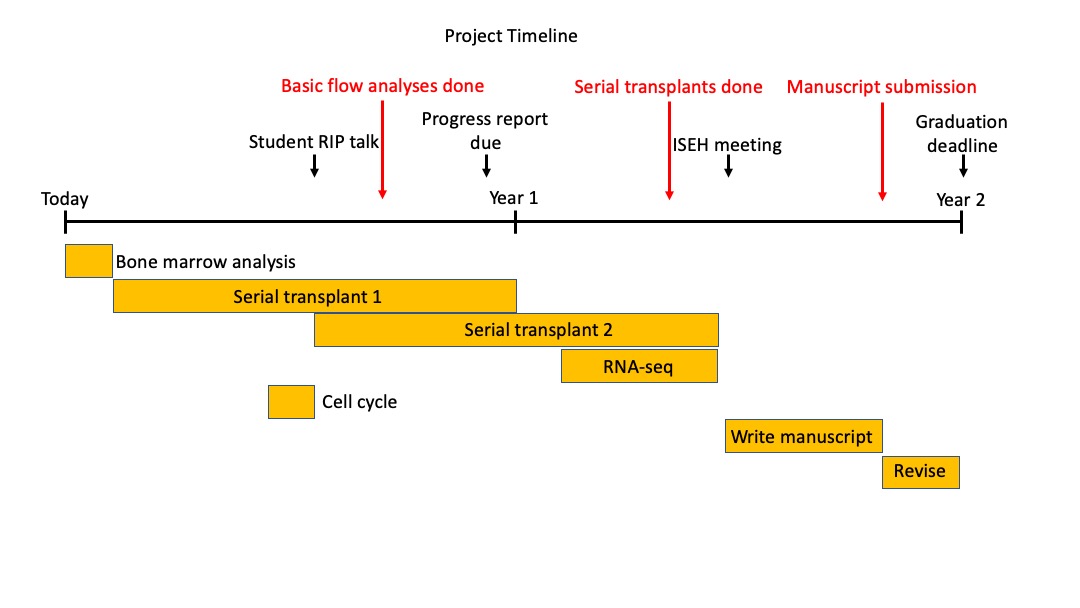
- Build your timeline. Now you can order all of your work packages in time
and incorporate key events that impact your planning. Suppose your
funding organization wants a progress report at the end of year 1, and
you want to ensure you have something to show them. Other key calendar
events may also come into play, like the annual ISEH meeting, research
in progress talks, or a thesis deadline. You can build project
milestones around these and use them as key ‘checkpoints’ for measuring
progress (Figure 4). With these in mind, start ordering tasks across
time. Notice how the serial transplantation assays come earlier than
later to ensure both replicate experiments can be done within the time
frame, and how the basic bone marrow analysis comes first to help
establish phenotype. Based on availability of mice, certain experiments
can be overlapped, but perhaps at the beginning the analysis can’t
overlap with transplant since mice aren’t available for both. This is
merely an imaginary example but notice how the timeline helps you order
your priorities based on resource availability and constraints on time
or personnel that you may have otherwise overlooked without going
through the planning.
 |
| Figure 4 |
- Revisit and revise. It comes without saying that no plan survives reality entirely intact. The goal of developing a project timeline is not to enforce an inflexible approach to doing your science, but rather to provide a context for revisiting priorities and time/resource constraints should setbacks occur. The sticky notes or whiteboard can always be repopulated with these items and the timeline evolved to reflect setbacks, new discoveries and changes in resources or personnel. Notice as well that by defining how effort and resources are allocated across time, the timeline allows you to identify potential points at which flexibility exists for starting a well-chosen side project. For this reason, it is crucial to revisit your timeline in a formalized way, probably quarterly. The bigger picture may not always be apparent or considered during the usual weekly meetings most groups have. It may also be important for group leaders to refocus the group or individual meetings to emphasize planning (what are the next objectives based on the timeline and how recently obtained data impact the timeline) and not simply reporting status (revisiting what data were generated over a period of time). Ultimately, taking a rigorous and disciplined approach to planning can increase efficiency to reach an endpoint and provide for flexibility when the science moves in an unexpected direction.

Eric M. Pietras, PhD
Assistant Professor, Division of Hematology
University of Colorado Anschutz Medical Campus
Aurora, CO


.png)


Comments
Post a Comment